Metrics
When running your code in AskAnna, you might want to track relevant metrics related to your run. With AskAnna it is possible to track metrics and to get tracked metrics from runs. You can use the Python SDK or the AskAnna API. The different ways to track and get metrics are described here.
Track metrics
When you are training models, working on experiments, or serving results you might want to track metrics that are relevant for the run. For example, with metrics you can compare the accuracy of runs, or see how a model's loss function is converging for every iteration.
If you are using Python, the AskAnna Python SDK makes it easy for you to track metrics. When you are working with another lanuage, you can use the AskAnna API to track metrics for your run.
Python
If you are running on Python, and you want to track a metric you only have to add two lines and make sure you installed the Python SDK.
The two lines:
from askanna import track_metric

track_metric(name, value)
When you run a job in AskAnna, every metric you track will be stored in the run. On the run page you find all metrics that are tracked for that run. For the value, AskAnna support the following data types:
- integer
- float/numeric
- string
- date
- time
- datetime (ISO8601)
- boolean
- tag
- dictionary
- list
If the value is of type list, we also try to detect the type of data in the list. If we can detect a unique type of data, the data type list is extened with the type of data in the list:
- list_integer
- list_float (also when the values are a mix of types integer and float)
- list_string
- list_date
- list_time
- list_datetime
- list_boolean
- list_mixed (when multiple data types are detected)
Local run
If you run the code locally, there is no run SUUID set. We store a temporary JSON file with metrics locally. We will print the location of the JSON file in case the run SUUID is not available.
It is also possible to add labels. For example, this can be usefull when you run multiple models and want to compare the accuracy per model. You can add a label, a list of labels, or a dictionary with labels with a value. If you add a label without a value, then it will be processed as a label with value type tag. Some examples:
track_metric(..., label="label a")

track_metric(..., label=["label a", "label b"])

track_metric(..., label={
                           "model": "regression",
                           "accuracy_type": "R-squared",
                         })
It's also possible to track multiple metrics at the same time. Use track_metrics and add a dictionary that you want to track. Optionally, you can also add labels to track_metrics.
from askanna import track_metrics

track_metrics({
                "accuracy": accuracy,
                "f1-score": f1score,
                "precision": precision,
              }, label="label a")
Get metrics
Run page
On the run page, you van view the metrics tracked for that run. In the next example we tracked the classification report from scikit-learn.
In the table you find find the name of the metric, and the value tracked. In this example we run different models, and we used the labels to make it possible to identify the metrics for the different models.
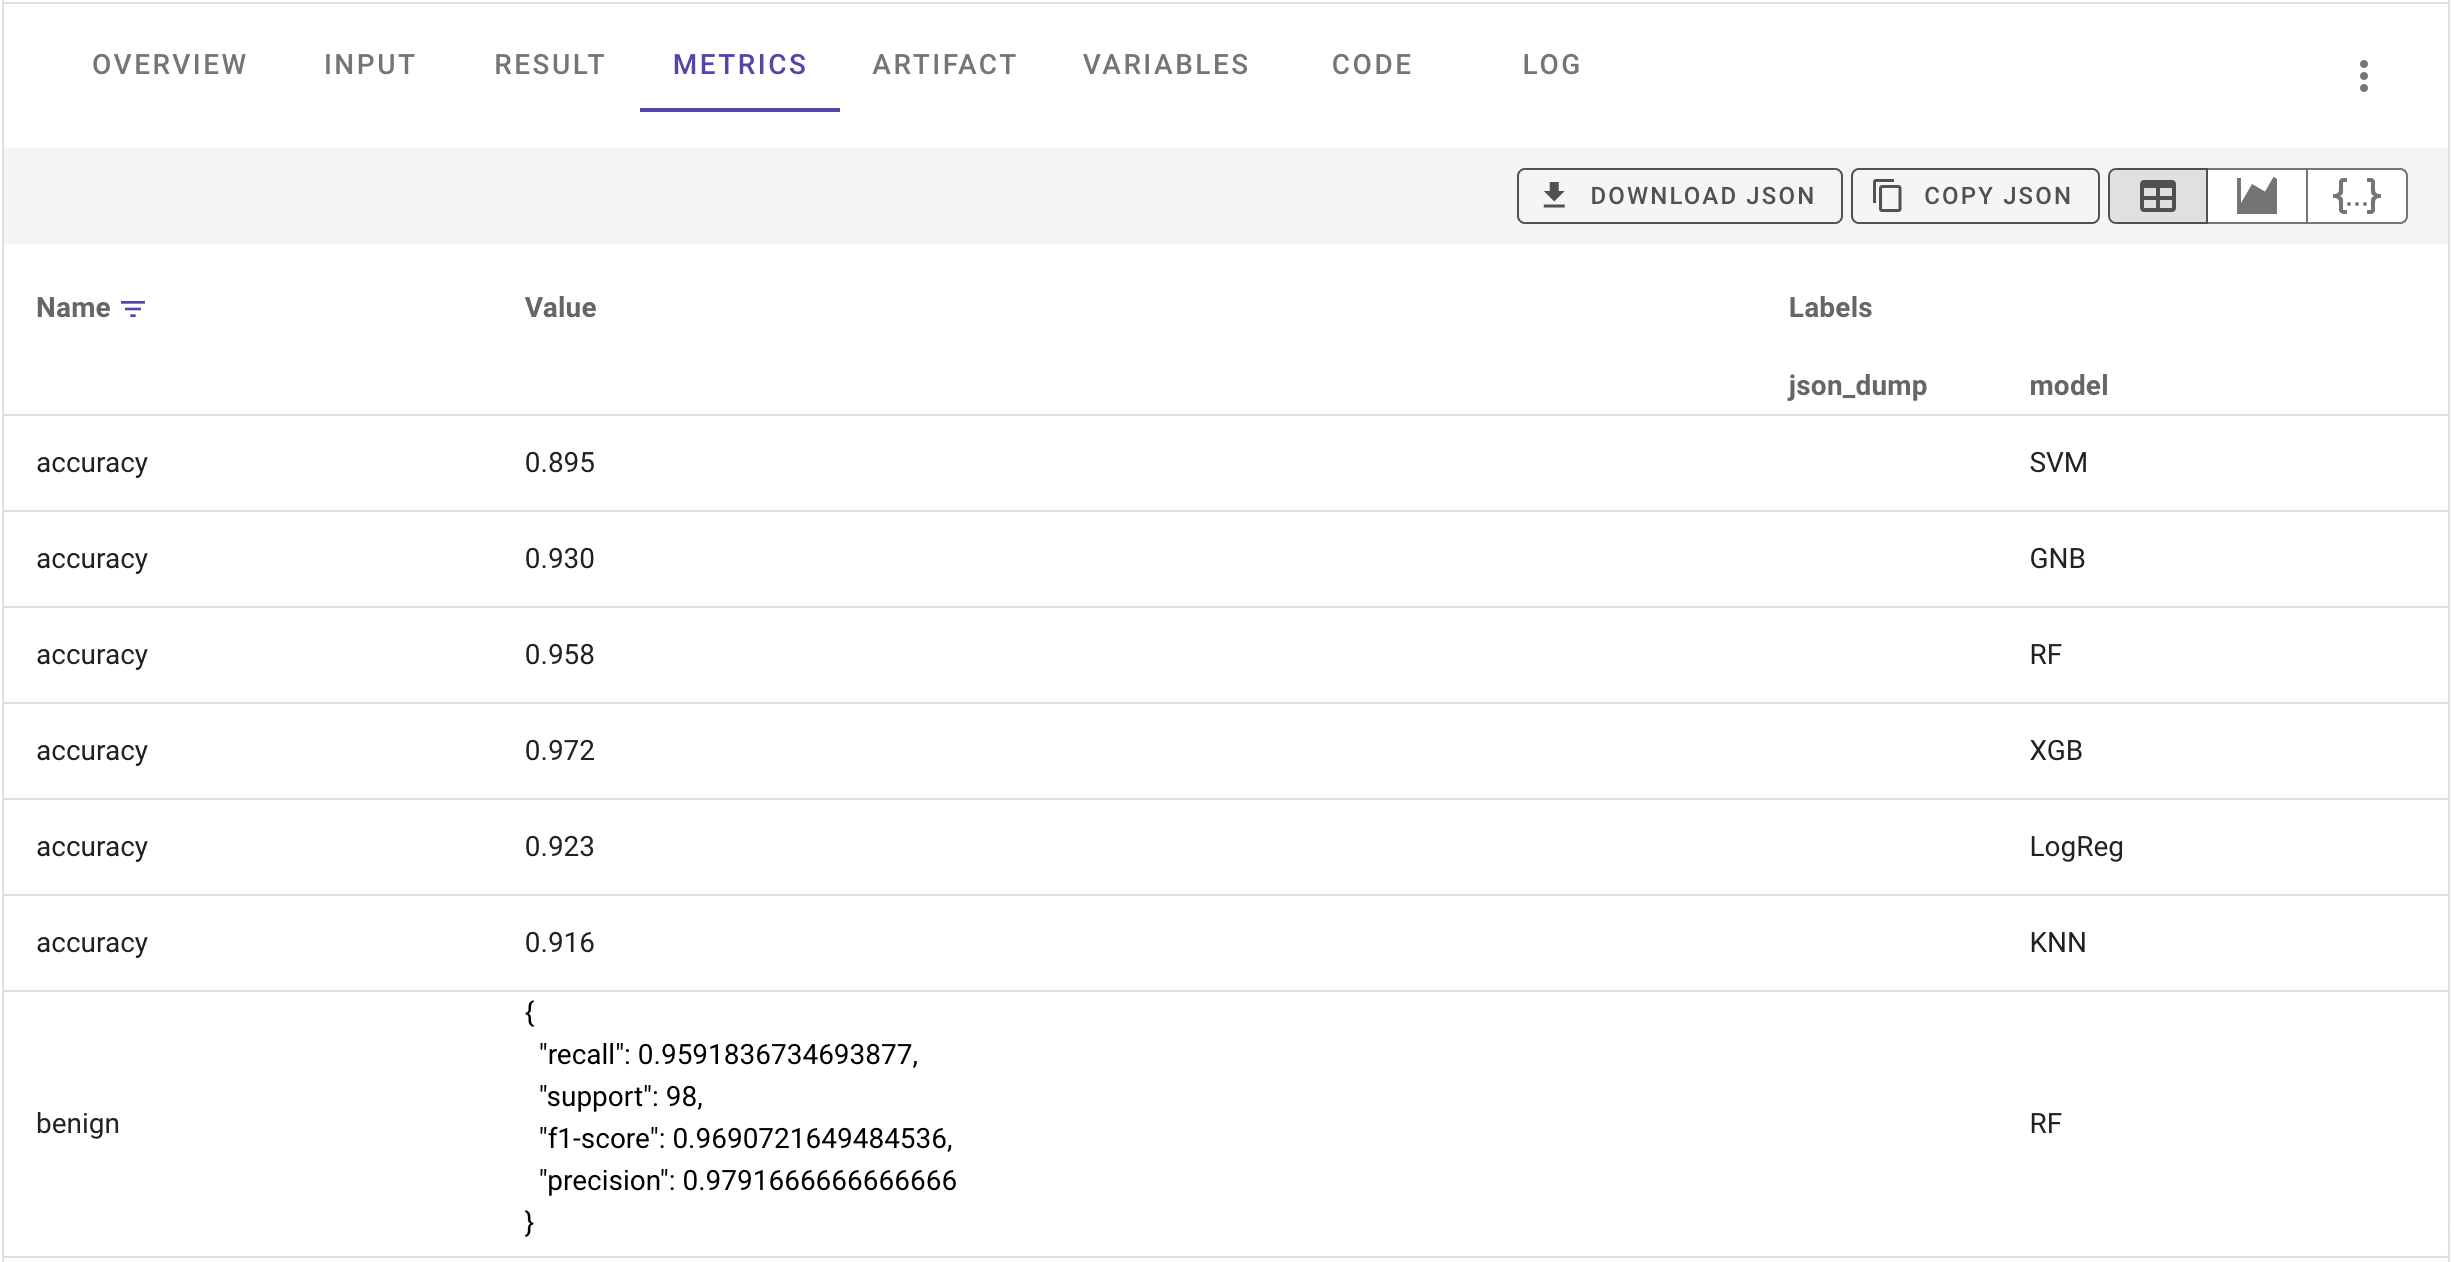
You also have the option to download or copy the JSON with the metrics for the run. An example of a JSON record:
[
    {
      "run_suuid": "6W94-5AmN-Xmvn-fLtH",
      "metric": {
        "name": "score",
        "type": "float",
        "value": 0.98
      },
      "label": [
        {
          "name": "model",
          "type": "string",
          "value": "constant learning-rate"
        }
      ],
      "created_at": "2022-06-16T16:11:17.699768Z"
    },
]
The JSON contains a record for each metric. You see the metric name, type and value. If labels are set, you will find a list with label records. Per label you also get the name, type and value. Further, you can see the SUUID of the run and the date-time the metric was created.
Next to the table view (), you can also select to view the metrics JSON (). And, you can visualize the metrics ().
Visualize metrics
Data in a table can be useful, but sometimes it is more powerful to visualize your data. AskAnna has an initial version implemented that you can use the create line graphs of your metric data:
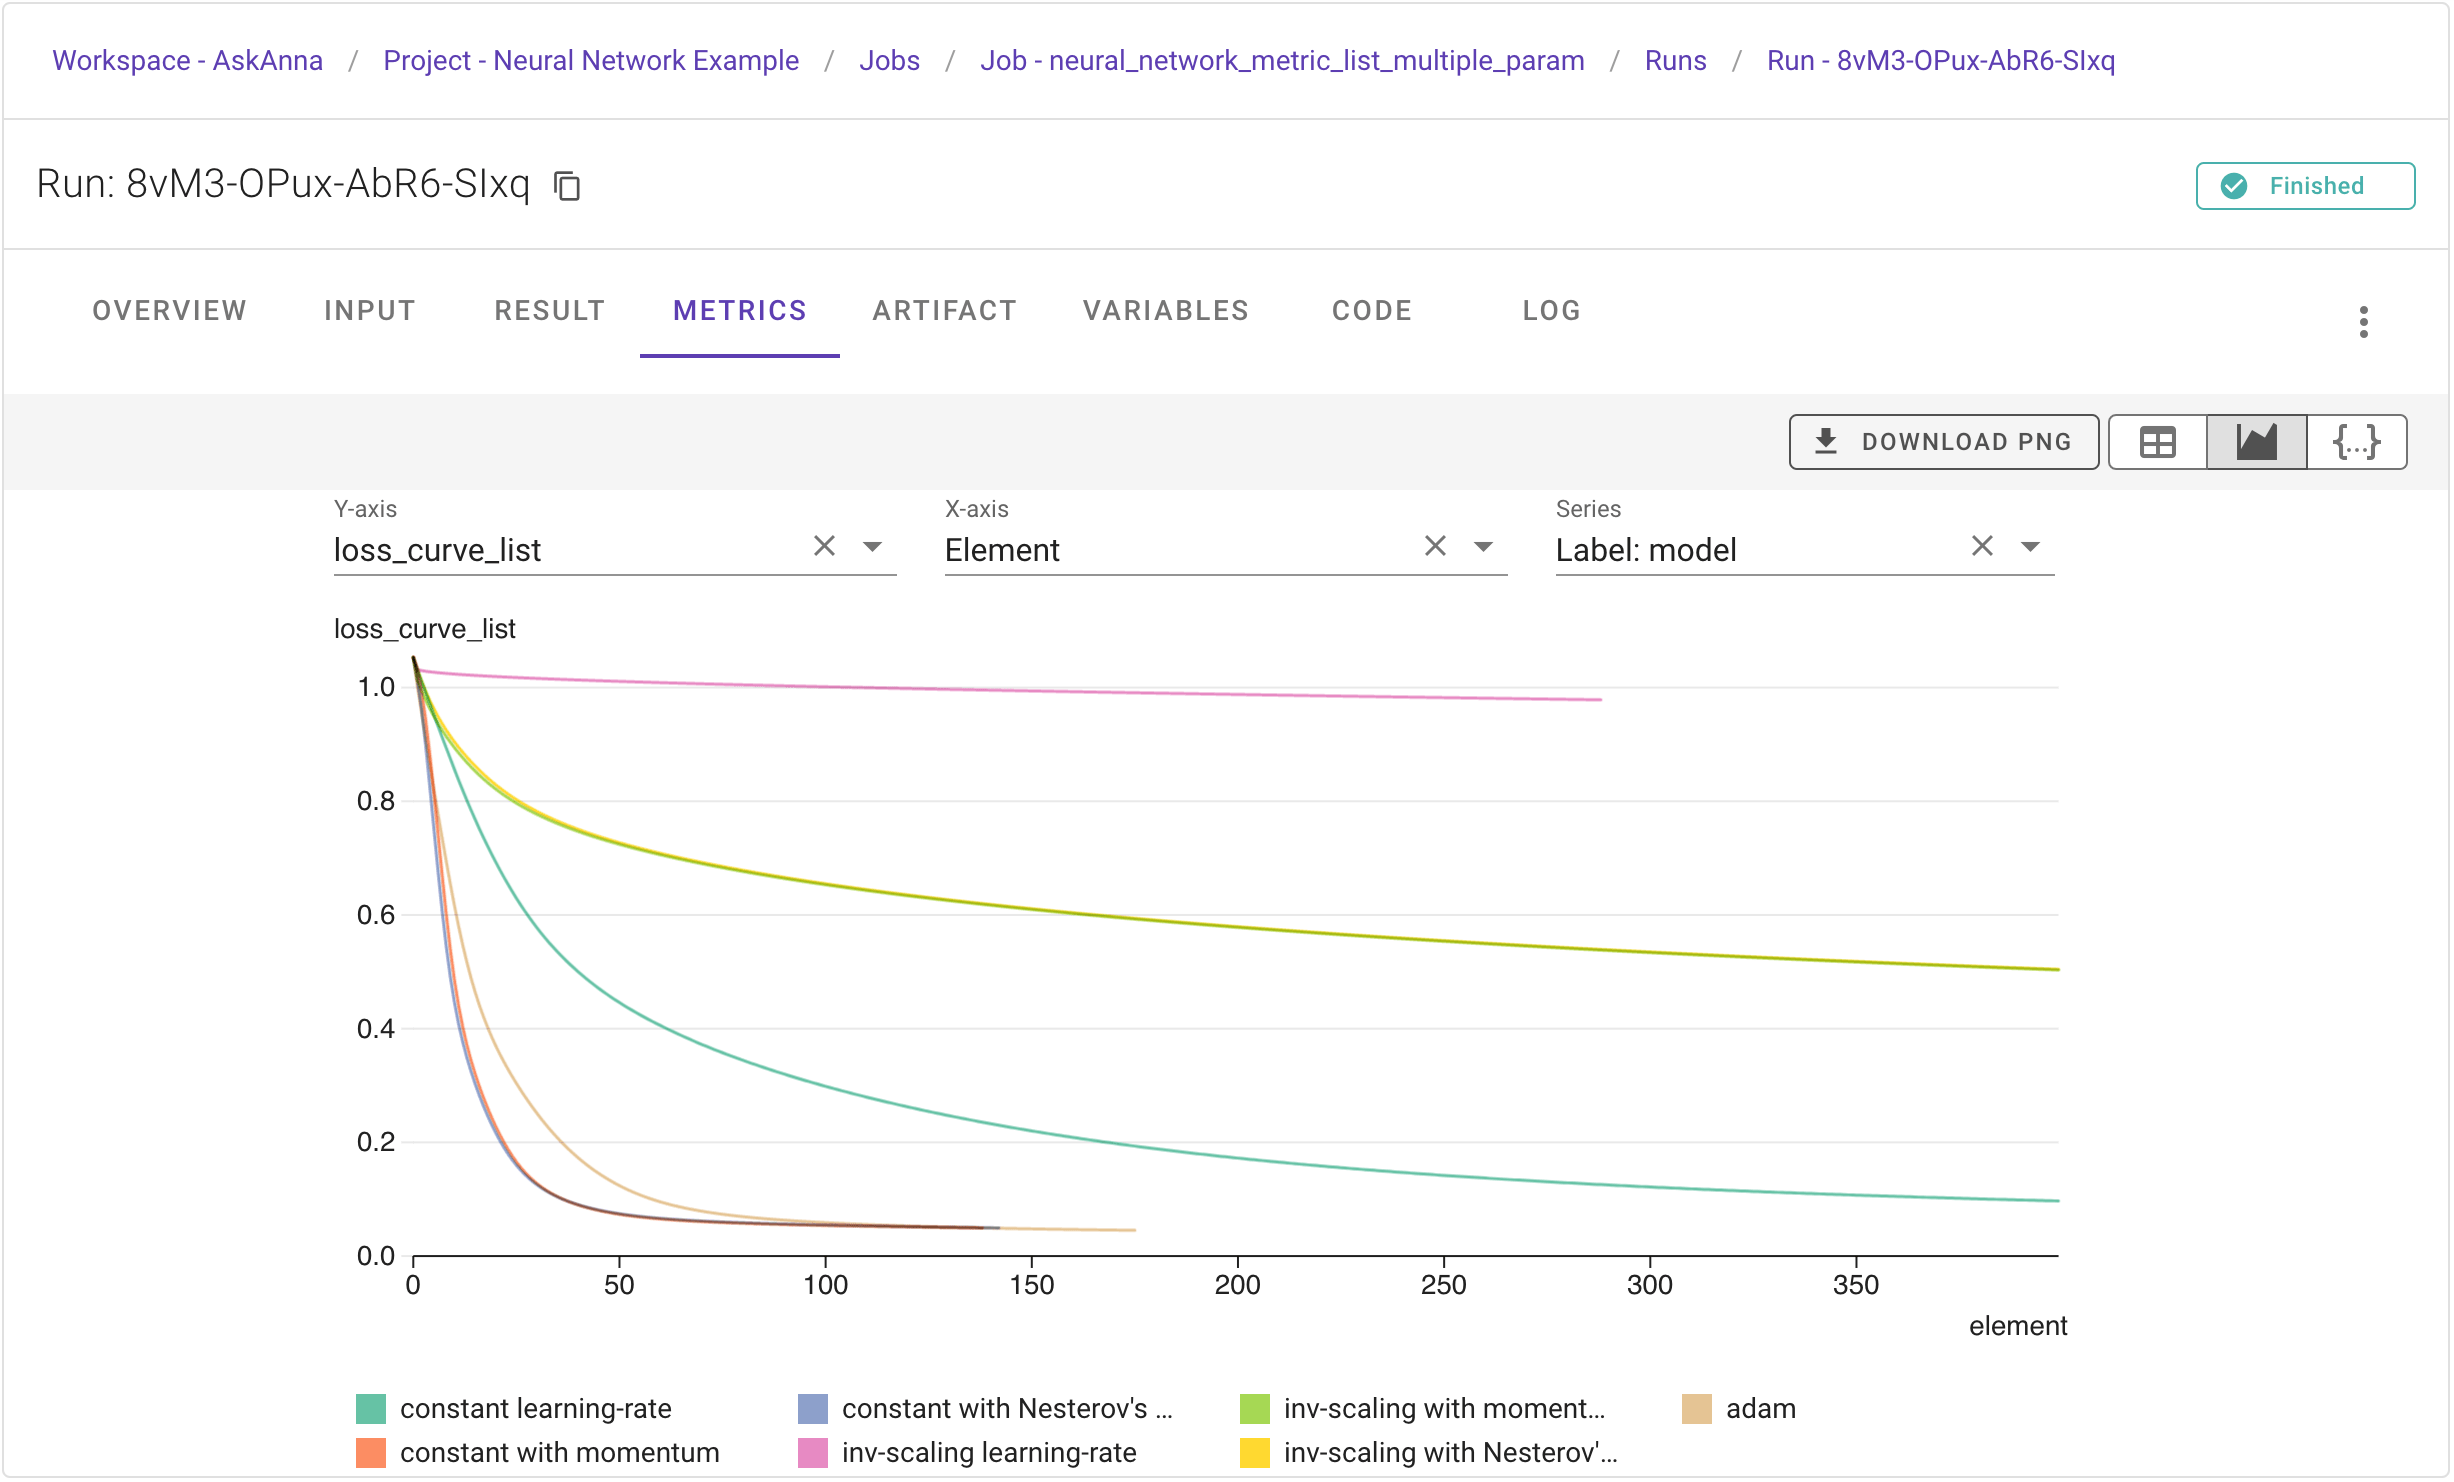
On the run page, when you choose the option to visualize metrics (), you get some fields where you can define the Y-axis, change the X-axis and optionally select a Series.
For the Y-axis options, AskAnna check the metrics and select the metric of types:
- float
- integer
- list_float
- list_integer
The default option for the X-axis is called Element. If the selected Y-axis value is of type float or integer, the metric values will be sorted on the created time and the first Y-axis value is then set as the first element. Or, if you choose a Y-axis value from the type list_float or list_integer, then the element is equal to the position in the list.
For the X-axis value you can also choose Date-time, which is the date-time the metric was created. And, if you have a Y-axis value from the type list, and you also have labels from the type list these labels can also be used as X-axis value.
For the Series the labels are used. For example, you have a run where you want to compare the loss curve of multiple models. The values for the loss curve are saved as a metric, and to identify the model you add a label with the model name. If you choose this label as a series, you get the individual lines labeled with the model name. In the image above you see an example.
Python
You can use the tracked metrics directly in Python. If you use run.get_metric you get the metrics of a specific run. The output is a MetricList with the metrics of the specified run:
from askanna import run

run_metrics = run.get_metric(run_suuid="{RUN_SUUID}")
If you want to filter the metrics, for example to only keep metrics with the name accuracy, you can use a filter:
metrics_accuracy = run_metrics.filter(name="accuracy")
If you use the runs module, you can also get all metrics from a job next to the other info this module provides. If you want to include metrics, you should set include_metrics to True. Note that by default we will return a maximum of 100 runs, you can increase the number_of_results value to get more runs.
from askanna import run

job_runs = run.list(
    job_suuid="{JOB_SUUID}",
    number_of_results=100,
    include_variables=True
)
If you want to get run information including metrics for a specific set of runs, you can list the runs you want to retrieve:
runs = run.list(
    run_suuid_list=["{RUN_SUUID_1}", "{RUN_SUUID_2}"],
    include_metrics=True
)
API
You can use the AskAnna API to retrieve the metric information. It's possible to get all metrics from a job, or to get the metrics from a single run:
GET /v1/run/{RUN_SUUID}/metric/
If we go back to the example from the run page. If you only want get get the metrics for accuracy, with the API you could filter them using the query param variable_name:
GET /v1/run/{RUN_SUUID}/metric/?metric_name=accuracy