Run page
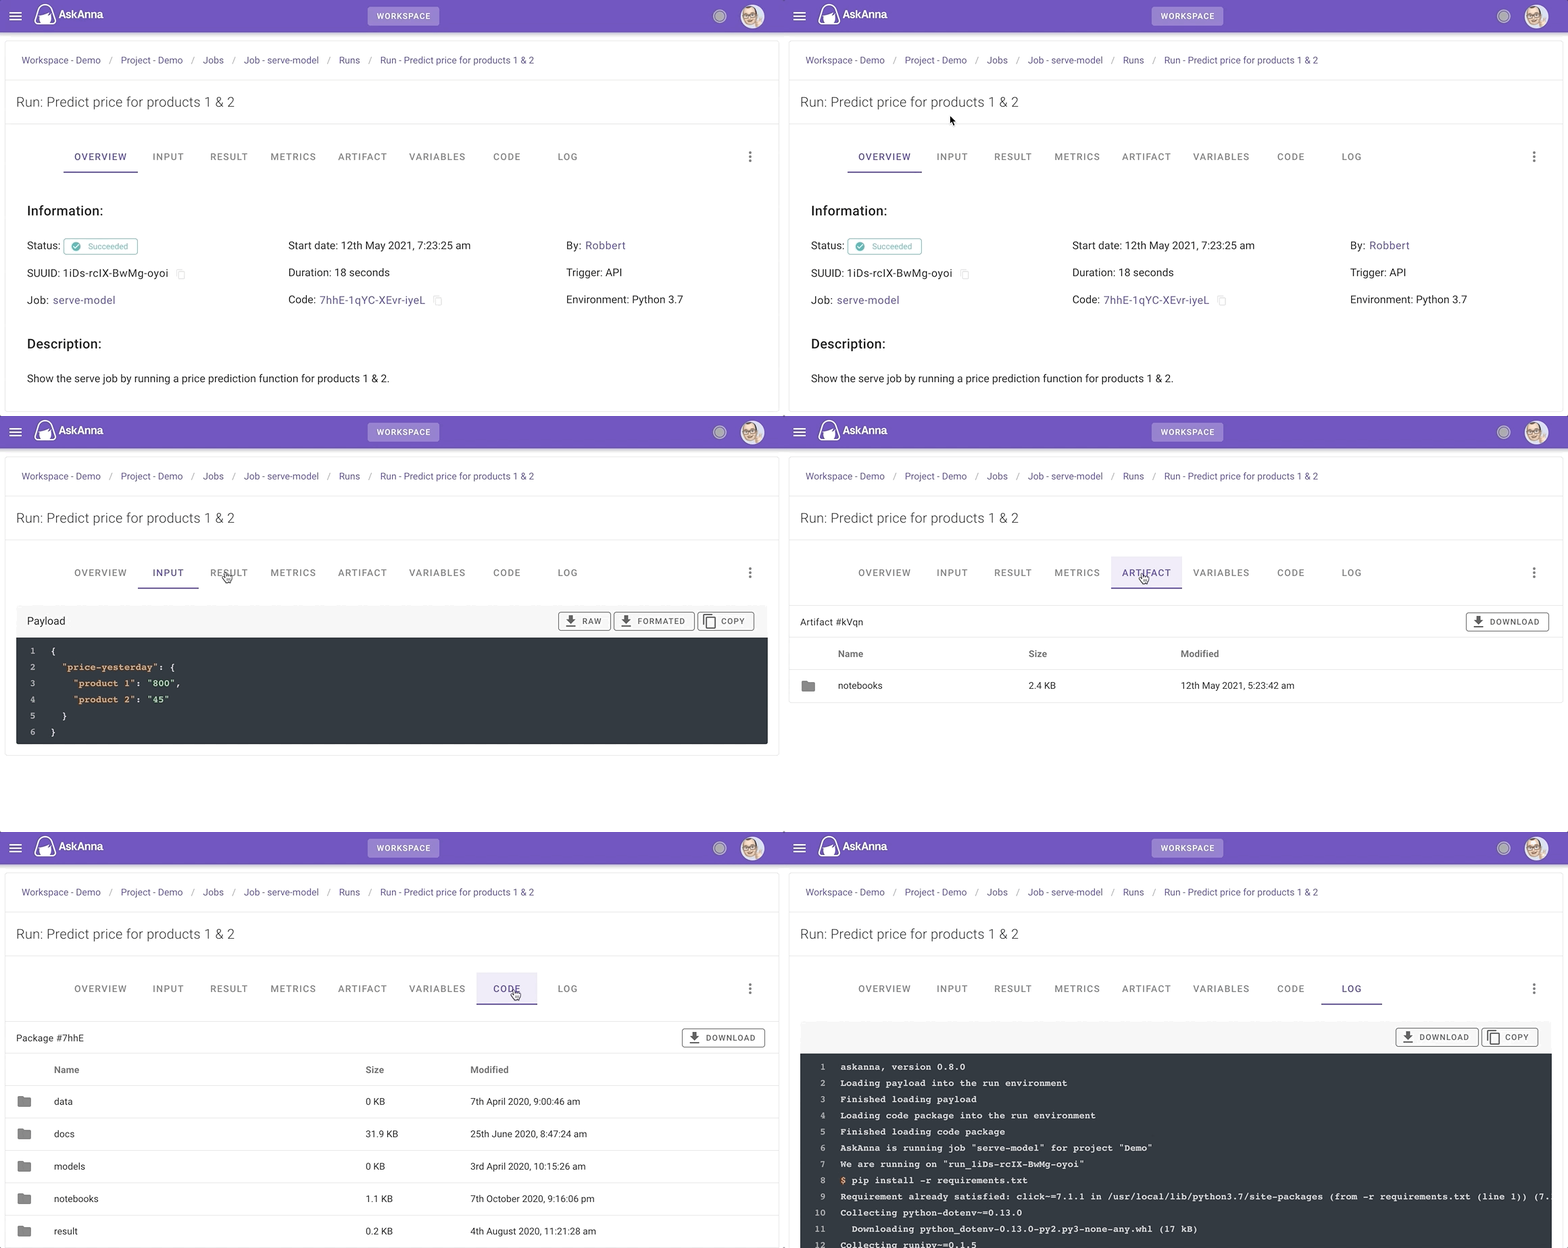
On the run page we list all information related to the run. Here you can find the meta information of the run, the input, results, metrics, artifact, variables, code and logs. An example of the run page:
When you open the run page, you will see:
- Title with name (if set) or SUUID of the run
- Navigation bar with tabs
In the navigation bar you find the next tabs:
| Tab | Description |
|---|---|
| Overview | Meta information of the run |
| Input | The input used for the run |
| Result | The result for the run |
| Metrics | The metrics tracked for the run |
| Artifact | Saved files and directories for the run |
| Code | The code version used on this run |
| Variables | The variables tracked by the run and set in the run environment |
| Log | The log (console output) of the run |
| Menu with additional options for the run |
On the tab OVERVIEW you can find the following meta-information about the run:
| Name | Description |
|---|---|
| Status | Status of the run |
| SUUID | SUUID of the run |
| Job | Name of the job used for this run |
| Start date | Date the run started |
| Duration | Duration of the run |
| Code | Version of the code used for this run |
| By | Member who triggered the run |
| Trigger | How the run was triggered |
| Environment | Environment/image used for the run |
For input we only support the JSON payload (for now). In both the payload and the result we assume that this is a JSON file. In the section you can see the content of the file. Also there is an option to download the file or copy the content of the file.
In the log section you can find the console output of the run environment. By default we load the first 100 lines, and when you have a larger log it will automatically load more lines when you scroll trough the log. Also you can download or copy the content of the log.
